Reviewed for accuracy by Jabin Travis, IADC WellSharp-certified driller.
Torque and drag are the most consistently available early warning on a rig, and among the most consistently misread. The mistake is nearly always the same: watching the number instead of the gap.
A torque reading is not a diagnosis. It depends on depth, angle, hole size, string configuration and mud lubricity — so a figure that is entirely unremarkable on one well is a serious warning on another. The information is not in the value. It is in the difference between what the string should be doing and what it actually is.
Key Takeaways
| Question | Answer |
|---|---|
| What is torque? | Rotational resistance — the load required to turn the string. |
| What is drag? | Axial resistance — seen in the spread between pick up, slack off and rotating weights. |
| What actually carries the signal? | The gap between measured and modelled, expressed as a friction factor. |
| When does the warning arrive? | Several connections before the raw value looks alarming. |
| Most common cause of a rising trend? | Poor hole cleaning — cuttings beds increasing contact. |
| Where does it end? | Stuck pipe, if the trend is treated as normal. |
Torque, Drag, and Where They Come From
Torque is what it takes to rotate the string. Drag is what it takes to move it along the hole. Both arise from the same physical cause: contact between the string and the wellbore, multiplied by however much friction that contact produces.
Anything that increases contact — a cuttings bed, a hole closing in, a dogleg pressing the string against the wall — raises both. Anything that increases friction at the contact, like degraded mud lubricity, does the same without any change in geometry.
That shared cause is why they are read together. Torque alone can be misleading; torque and drag moving together, or notably not moving together, narrows the possibilities considerably.
The Three Weights
Drag is not measured directly. It is inferred from three hookload readings taken at the same depth:
- Rotating off bottom — the string turning but not being moved axially. Axial drag is largely removed, so this is closest to true string weight in the hole.
- Pick up — pulling out. Drag opposes the motion, so it acts downward and pick up weight is higher than rotating weight.
- Slack off — running in. Drag again opposes motion, now acting upward, so slack off weight is lower.
The spread between them is the drag. Taking all three matters because it separates a genuine friction change from a weight change: if the string got heavier, all three rise together. If friction rose, the spread widens while rotating weight stays put.
Direction is informative too. Pick up climbing while slack off stays normal points at something that resists upward movement specifically — a keyseat being the classic case, since the string passes down through the slot freely and jams on the way out.
Modelled Versus Measured
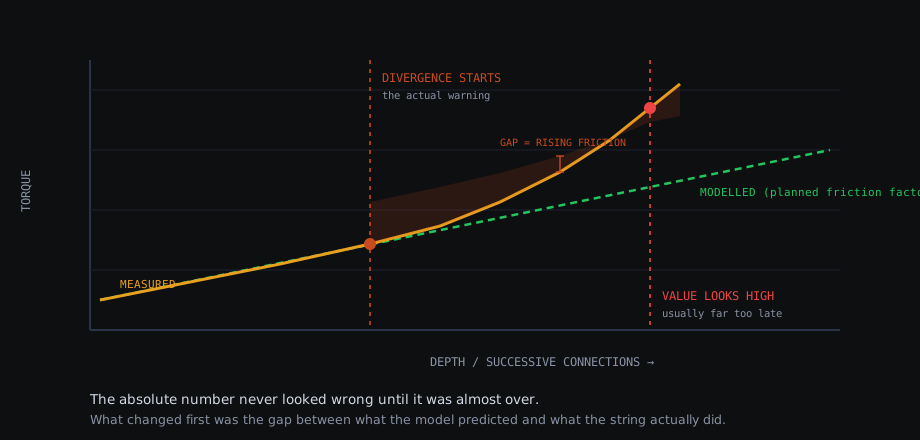
This is the whole discipline in one picture.
A torque and drag model predicts what loads should be seen for a given well path, string and mud, using a friction factor — a single calibrated number representing how much resistance the string meets. Early in a section, the model is tuned until predicted loads match measured loads. That calibrated friction factor becomes the baseline.
From then on, the useful question is not “is torque high?” but “is the friction factor rising?”
Look at where the two lines separate on the chart. That divergence starts several connections before the absolute value reaches anything that would prompt a second glance. By the time the raw number looks alarming, the trend has been running for hours.
This is also why a model that was never calibrated is close to useless. An uncalibrated prediction tells you what a textbook well would do. A calibrated one tells you what this well was doing yesterday, which is the only meaningful comparison.
What a Rising Trend Actually Means
A widening gap says friction is increasing. It does not say why. In rough order of likelihood:
Poor hole cleaning. The most common cause by a distance. Cuttings beds increase contact area along the low side of the hole, and the effect compounds as more solids accumulate. Confirmatory evidence is at the shakers — cuttings volume below what the drilled footage implies. Covered fully in hole cleaning in high-angle wells.
Wellbore instability. Shale sloughing or a stressed formation closing in reduces clearance. Look for cavings rather than cuttings over the shakers, and hole taking more fill than calculated on trips.
Differential sticking developing. Rising drag with normal circulation, especially after connections on a permeable interval, can be the early stage of the pipe beginning to bed into filter cake — see differential sticking.
Keyseating. Characteristically direction-specific and depth-specific: overpull at a consistent depth on the way out, with down still free.
Mud lubricity. A change in mud properties can raise friction with no geometric change at all, which is why mud checks belong in the same conversation.
The point of the list is that a rising friction factor is a prompt to look, not a conclusion. The confirmatory evidence — shakers, hole fill, circulation state, which direction is tight — is what separates these.
Making the Trend Readable
The trend is only as good as the consistency of the measurements behind it.
Same conditions. Take pick up, slack off and rotating weights at the same depth reference, at consistent rotation and pump rates. Readings taken under varying conditions produce scatter that hides exactly the signal you are looking for.
Same discipline every connection. A trend built from occasional readings when someone remembered is not a trend. This is unglamorous and it is the whole job.
Plot it. A table of numbers hides divergence that a chart makes obvious. This is precisely where real-time drilling data systems earn their cost — not by measuring anything new, but by making the comparison against the model continuous and visible rather than something reconstructed after the fact.
Record the context. A step change after a bit trip, a mud weight change or a section of sliding is explainable. The same step change with nothing to explain it is not.
The Other Limit
Torque and drag are not only diagnostic. They are also a hard constraint.
Rotational torque is limited by the make-up torque of the connections and the capacity of the top drive. Hookload is limited by the derrick and by the tensile capacity of the weakest joint — which for used pipe is set by its inspected class, not the grade stencilled on it, as covered on the drill string page.
High torque also drives casing wear, because a string rotating under side load grinds against the casing it passes through. On extended-reach wells this becomes a design constraint rather than an operational annoyance, and it is one of the reasons well profiles are chosen to keep torque manageable rather than to take the shortest route — see directional drilling.
Conclusion
Torque and drag give more warning than almost anything else available, and they give it early — but only against a baseline. The number on its own is noise. The gap between measured and modelled is the signal, and it opens well before anything looks dramatic.
The habit worth building is unremarkable: take the three weights consistently, plot them against a calibrated model, and treat divergence as a reason to look at the shakers rather than a reason to note it and carry on. Most stuck pipe events were visible in this data for hours beforehand.
Where it ends if the trend is ignored, and how to tell the mechanisms apart once the string does stop moving, is in stuck pipe and fishing operations.
Frequently Asked Questions
What is the difference between torque and drag?
Torque is the rotational resistance felt when turning the string, measured at surface as the load required to rotate. Drag is the axial resistance felt when moving the string along the hole, seen as the difference between hookload while picking up, slacking off and rotating off bottom. Both come from contact between the string and the wellbore.
Why is a torque value meaningless on its own?
Torque depends on depth, hole angle, mud lubricity, string configuration and hole size, so a figure that is entirely normal on one well can be a serious warning on another. What carries information is the difference between measured torque and what the model predicted for those conditions.
What is a friction factor in torque and drag modelling?
It is a single calibrated number representing how much resistance the string meets against the wellbore. The model is tuned so the predicted loads match measured loads early in the section, and that calibrated friction factor becomes the baseline. A rising friction factor means conditions are deteriorating even if raw torque still looks acceptable.
What do pick up, slack off and rotating weights tell you?
Rotating off bottom weight gives the string weight with axial drag largely removed. Pick up weight adds drag acting downward and slack off weight subtracts drag acting upward. Comparing the three separates genuine friction changes from weight changes, and the direction of the change points at different mechanisms.
What causes torque and drag to rise during drilling?
Most commonly poor hole cleaning, where cuttings beds increase contact between string and wellbore. Other causes include wellbore instability narrowing the hole, differential sticking beginning to develop, keyseating at a dogleg, undergauge hole, and degraded mud lubricity.
How early does a torque and drag trend show a developing problem?
Divergence from the modelled line typically appears several connections before the absolute value looks unusual. That gap is the useful warning window, which is why the comparison against a calibrated model matters more than watching a raw number against a mental threshold.